Perceptibility
Finally, we look at perceptibility of the aforementioned attacks. In figure 17 you can see the unmodified image on the left and attacks with FGSM, BIM and ILLM. To make them comparable we attack with FGSM first and choose the highest adversarial confidence, which is around 24% here. Next, we attack with BIM and find the first adversary for which the model has a similar confidence, also 24%. It achieves this at an epsilon of 4 instead of 20 which makes this attack much less noticeable. For ILLM we cannot find an adversary with similar confidence. Instead, we choose an epsilon of 20 as for FGSM.

Subjectively, BIM generates the least perceptible adversary. At the same time it also generates the most confident adversary with around 60% for an epsilon of 12. We have seen this for other images as well. BIM was for example able to change a correct, 90% confident detection of a fly to a 100% confident prediction of a bow (sample 894).
Instead of simply looking at individual images, it would be convenient to have a quantitative measure of perceptibility or how much the original image has been perturbed. Considering that there are three colour channels, we used the norm of the differences of the pixels averaged over the entire image, which can be calculated as follows for one pixel:
\begin{equation} \tag{5.1} \sqrt{(X_{ch0}-\widetilde{X}_{ch0})^2+(X_{ch1}-\widetilde{X}_{ch1})^2+(X_{ch2}-\widetilde{X}_{ch2})^2} \end{equation}
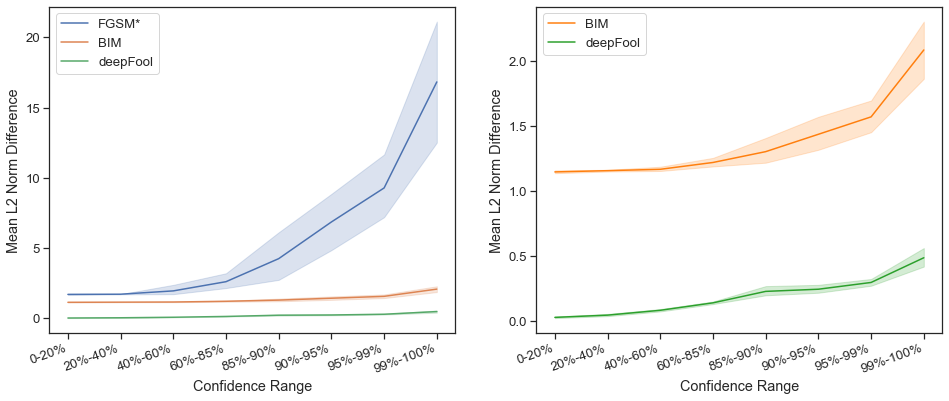
As can be seen in Figure 18, generally a successful untargeted attack is more perceptible with increasing initial confidence of the clean image. In other words, generally images with high initial confidences in the correct label are less susceptible to adversarial attack. However, what can also be seen is that what type of attack seems to matter more.
At lower initial confidences, BIM and FGSM have very similar perceptibilities, likely because they act similar to each other with minimal iterations for BIM. FGSM, however, requires much higher epsilons than BIM for the more difficult images. FGSM was even unable to successfully create some adversarial examples for epsilons up to 20 which creates very noticeable perturbances. Generally though, FGSM requires only very small pixel perturbances (around 3 pixel intensity values per channel) for initial confidences up to 85%.
DeepFool, does significantly better than BIM by requiring a smaller perturbance. It should be noted though that the deepFool results created adversarially examples with non-integer pixel intensity values. Both BIM and deepFool only create an average pixel perturbation of only 1 or 2, unlikely to be noticed by the human eye.